Toratora Travel
Toratora offers tailored "surprise trip" experiences by customizing travel packages to user preferences, with the destination revealed just before departure. Our challenge was to personalize travel using insights from user flow data. I led the branding and art direction, shaping a unique visual identity for Toratora.
BRANDING & VISUAL IDENTITY
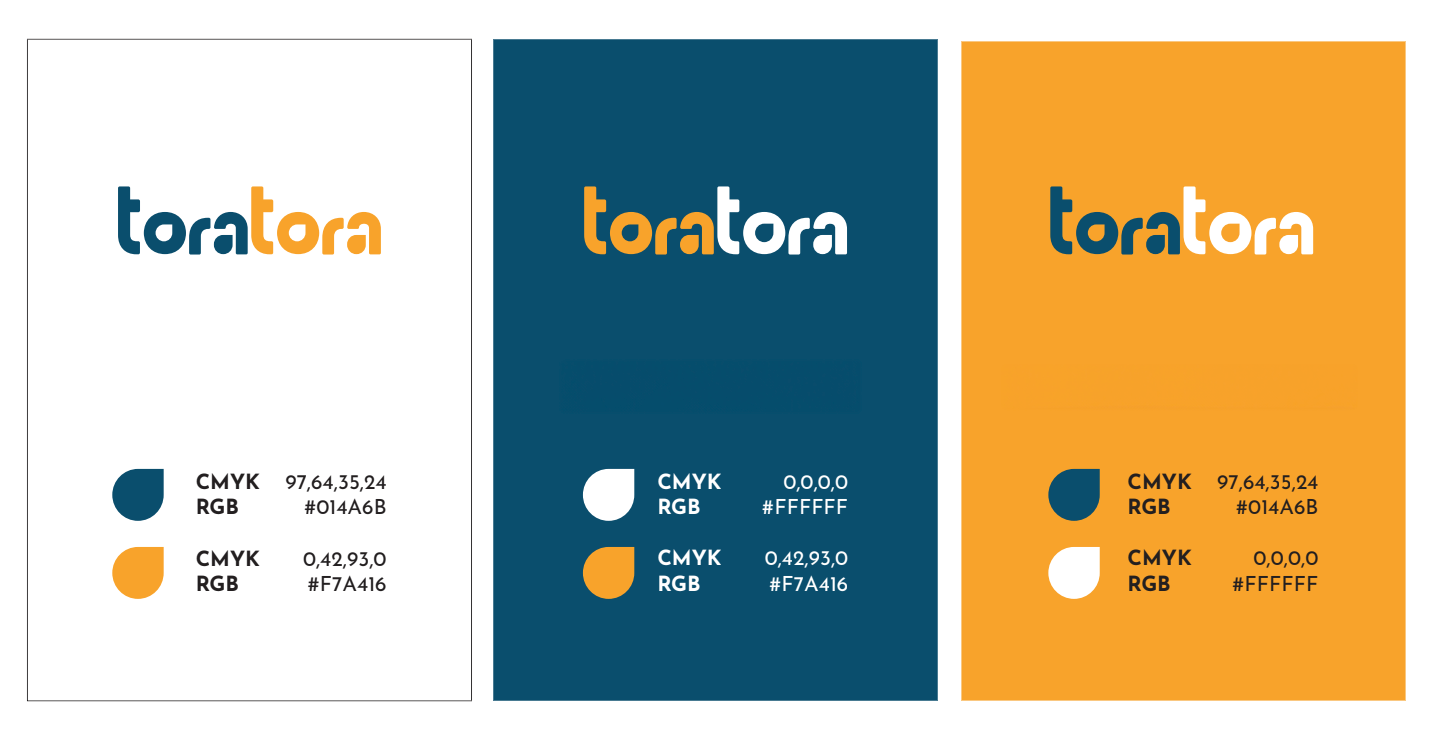
We designed the Toratora logo to blend the dynamism of orange seamlessly, symbolizing adventure and discovery with the reliability of blue, evoking trust and comfort. This fusion mirrors our ethos: delivering unexpected journeys with the dependability and attention our customers deserve. The fluid shapes of the logo we crafted hint at a continuous voyage, full of surprises yet always anchored in trust.
PROTOTYPE DEVELOPMENT AND USABILITY INSIGHTS
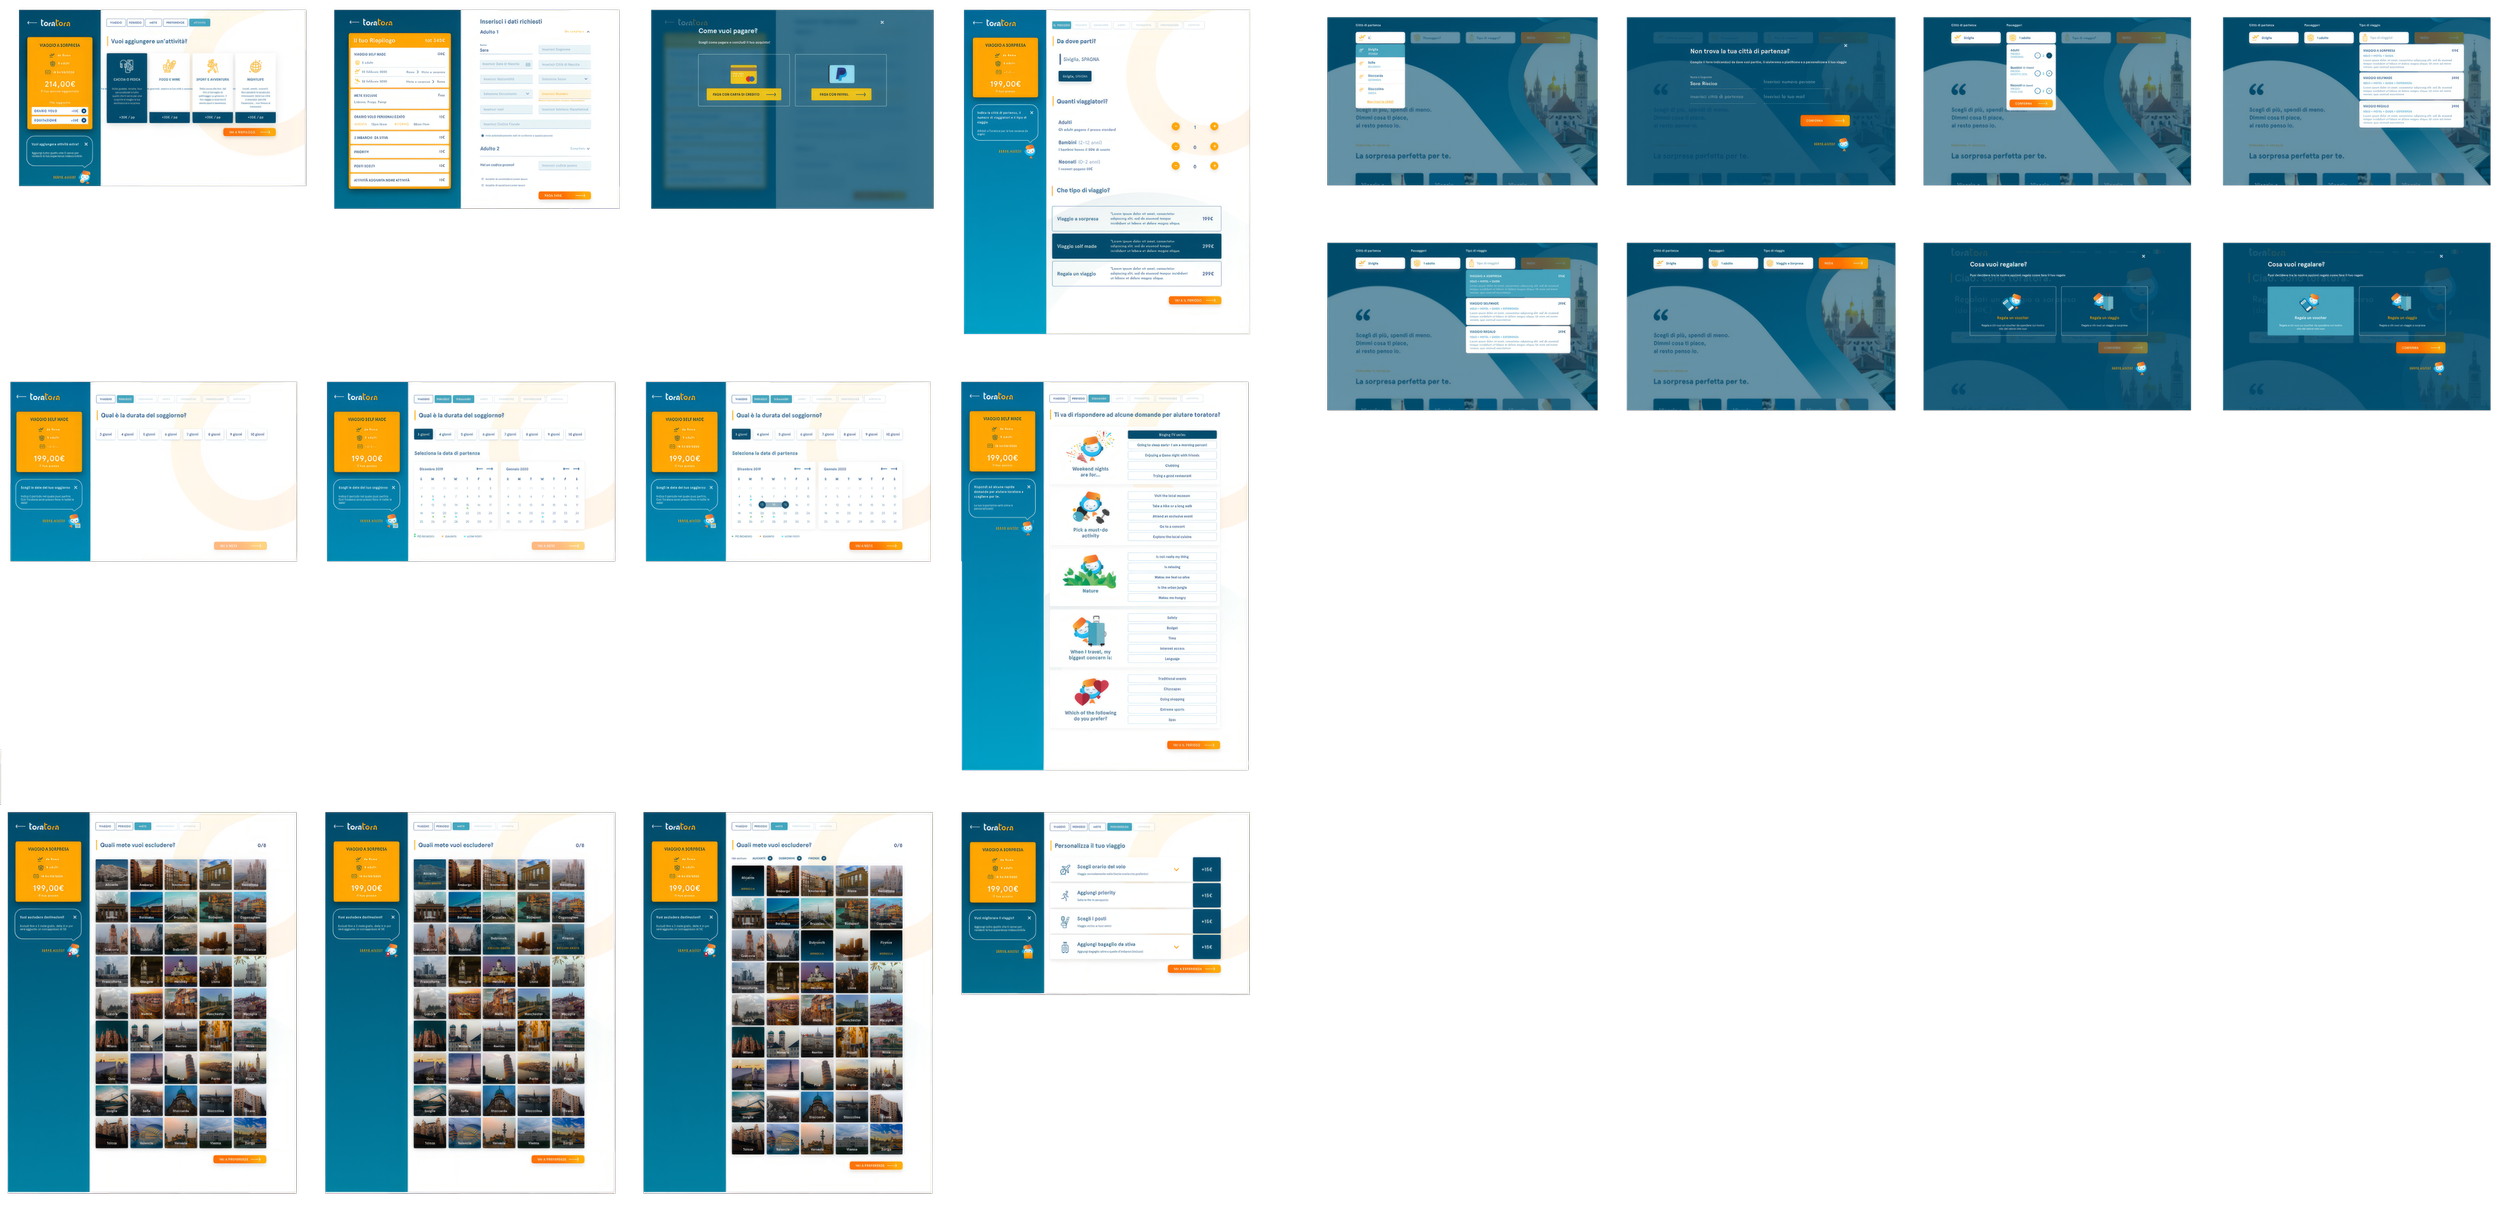
Our goal at Toratora was to craft travel packages uniquely tailored to each user's preferences, requiring a deep understanding of our audience. In developing our beta website, we implemented a streamlined approach, embedding wireframing principles into our live design iterations. This integrated method accelerated testing and refinement, smoothly transitioning from concept to functional prototype, grounded in user-centric and agile design practices.
HEATMAP
Crucially, using heat maps and user flow drop-off charts was pivotal. These tools swiftly revealed strengths and areas for improvement in our prototype, enabling us to address usability issues quickly. This focused, data-driven approach was vital in developing a platform that genuinely aligns with our users' diverse needs, embodying our vision for personalized travel experiences.
USER FLOW DROP-OFF CHART
ACCESSIBILITY CONSIDERATIONS
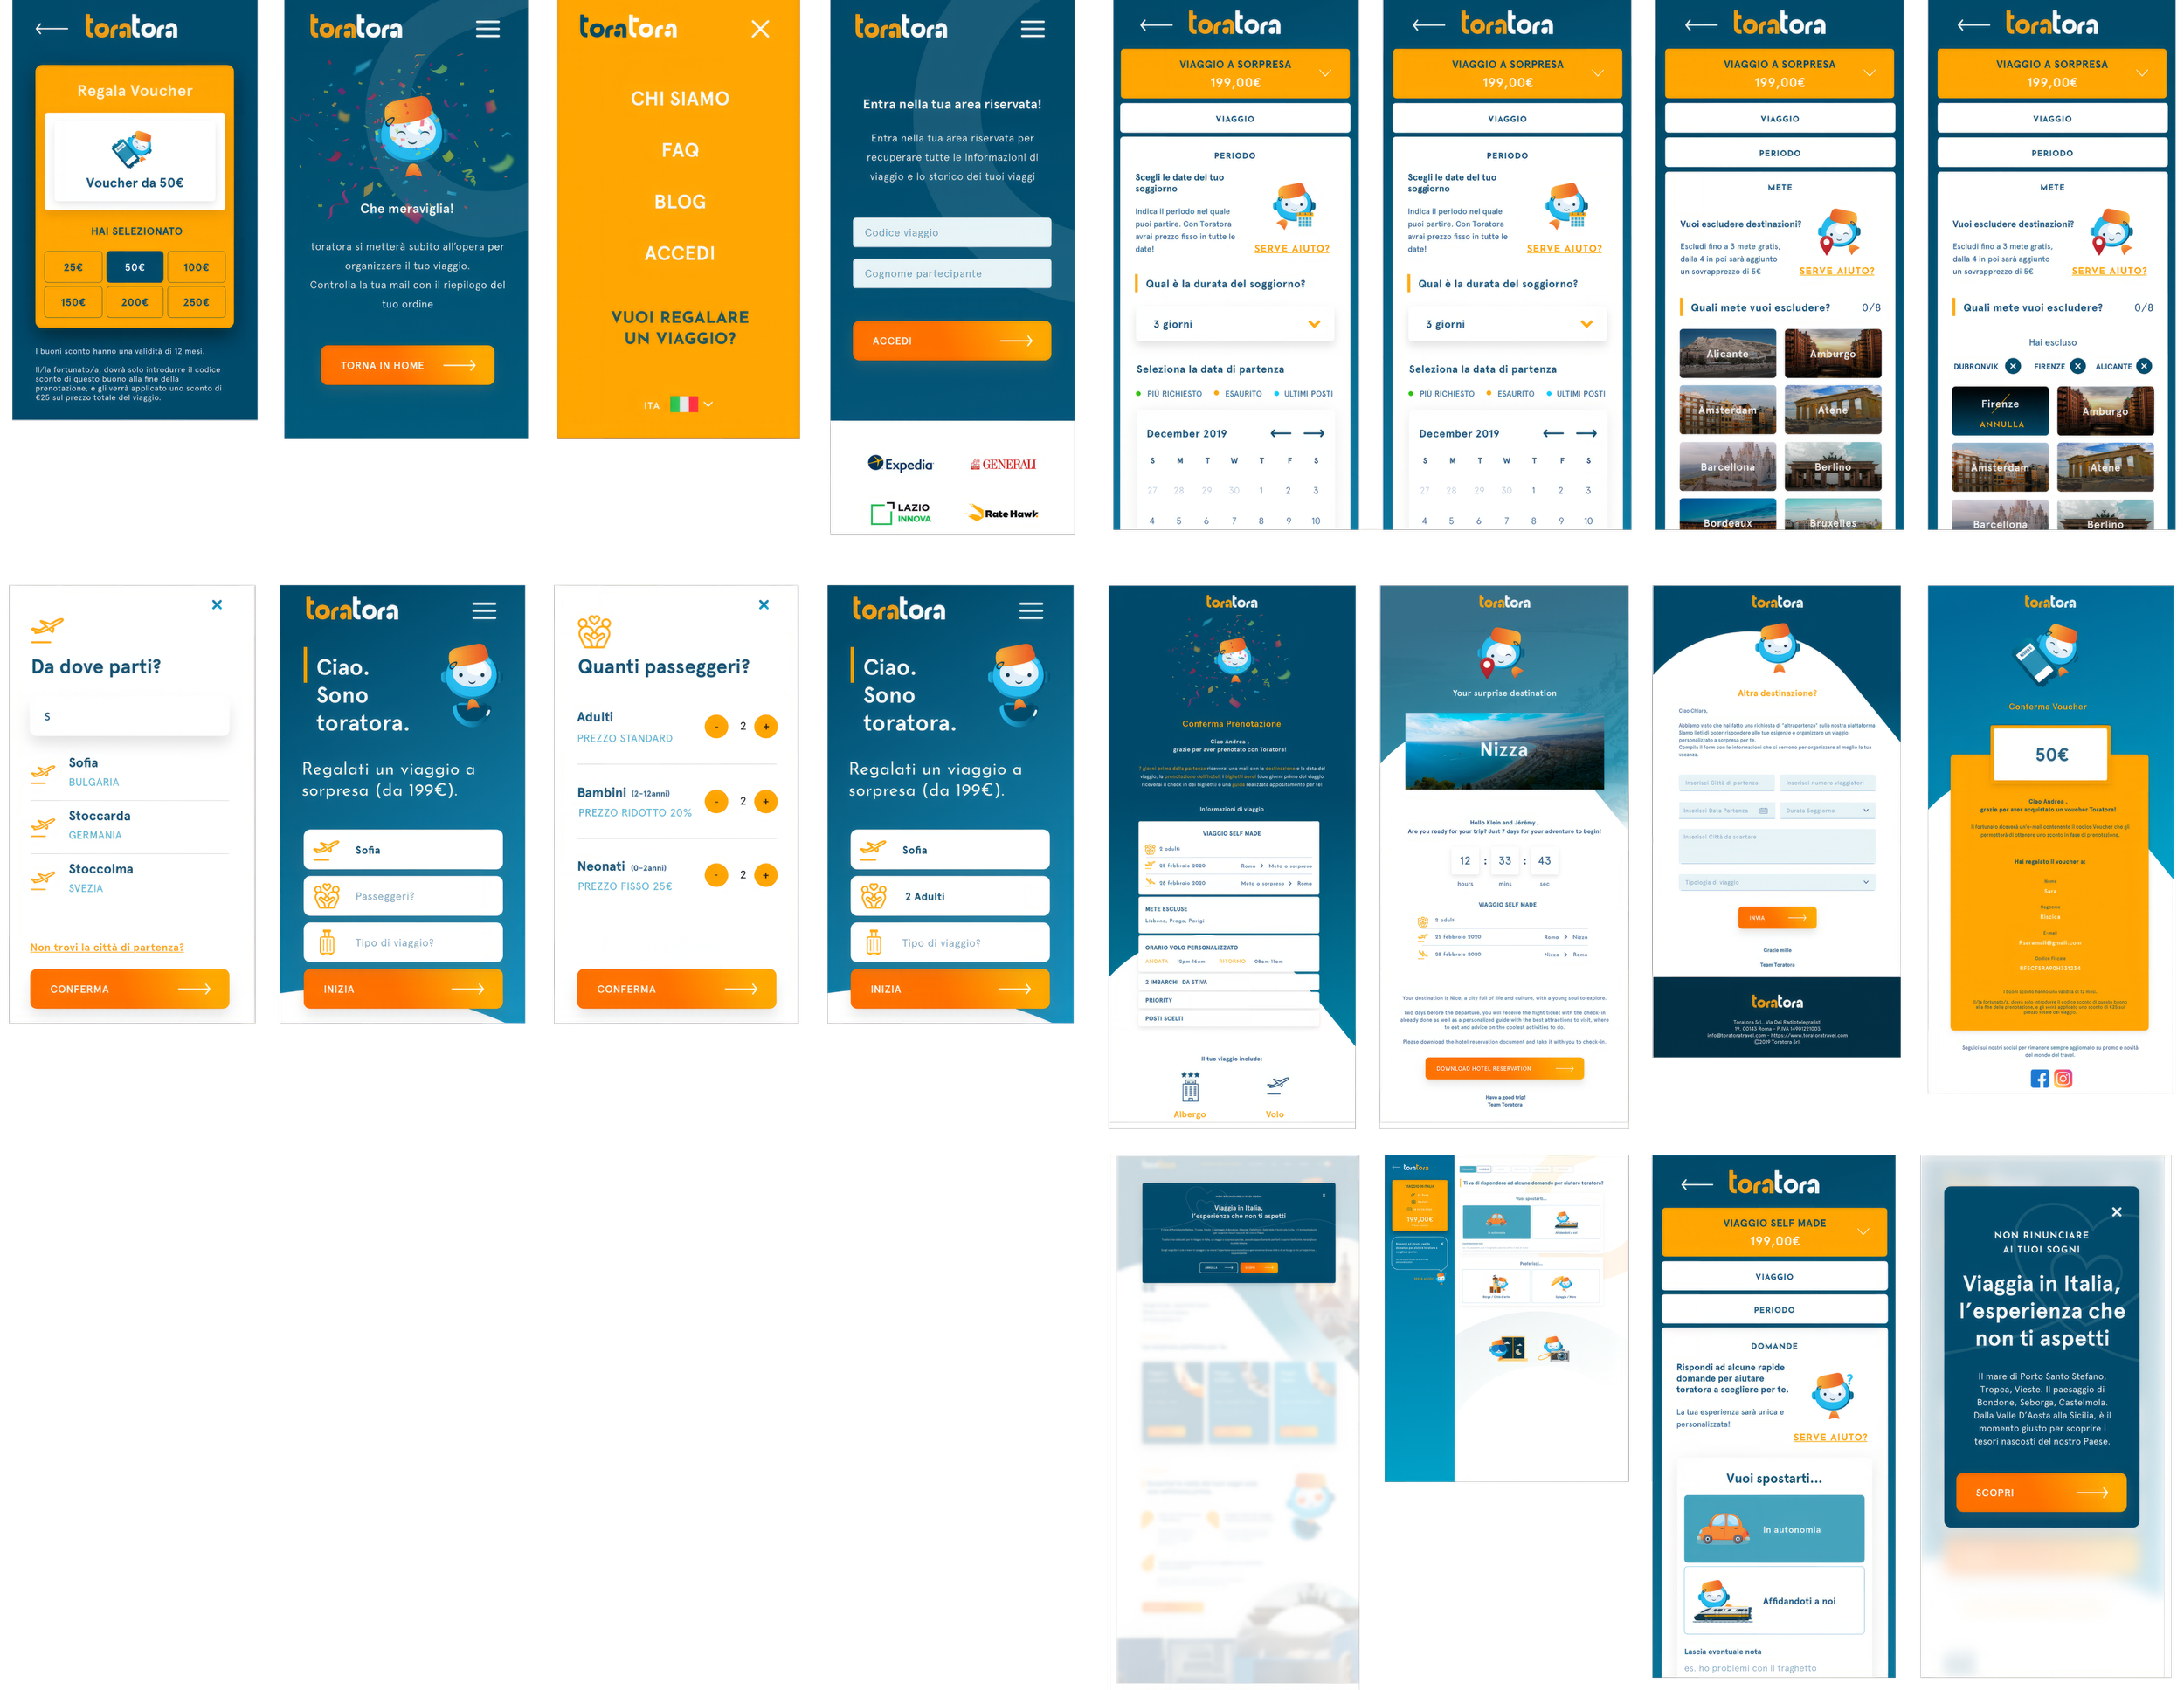
In designing Toratora, we ensured accessibility was a priority. This included implementing alt text for images, providing color contrast to meet WCAG guidelines for users with visual impairments, and creating a keyboard-navigable interface for those unable to use a mouse. We aimed to create a travel platform that includes all users, regardless of their physical abilities.
FINAL PROTOTYPES AND LAUNCH
In the final phase of Toratora's development, we refined our prototypes, notably streamlining the user flow from eight steps down to five, directly leading to the payment page. This optimization made the booking process more efficient and user-friendly.
A crucial feature we introduced is a dedicated page for users to share their travel preferences, aiding our machine-learning algorithms to suggest destinations accurately. We strategically disseminated input fields throughout the user journey, subtly gathering vital information to fine-tune our travel recommendations.
Additionally, we implemented a customization page for trip specifics like flight times, baggage, and activities. These preferences are used by our algorithms to arrange activities that align with the user's interests, enhancing the overall travel experience.
These enhancements, focusing on user ease and personalization, were instrumental in the successful launch of Toratora, ensuring a tailored and seamless travel booking experience.


